| Under 15 | 16-25 | 26-35 | 36-45 | 46-55 | Over 55 | |
| Emotion | -0.24114 | -0.40964 | -1.46853 | 1.290165 | -0.60894 | 0.198894 |
| Feeding | 1.407946 | 1.228932 | 0.689311 | -0.11729 | -1.0709 | -1.44908 |
| SocioSex | -0.21003 | 0.292603 | 0.569431 | -1.14942 | 1.028903 | 0.426201 |
| Parenting | -0.95678 | -1.11189 | 0.20979 | -0.02346 | 0.650939 | 0.823988 |
Table D1: Scaled mean values of female motivational humor scores
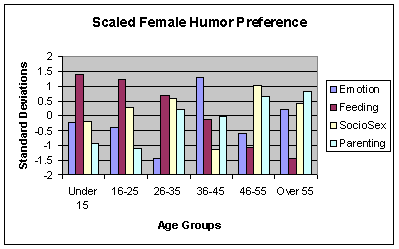
Fig. D1: Scaled mean values of female motivational humor scores
| Under 15 | 16-25 | 26-35 | 36-45 | 46-55 | Over 55 | |
| Emotion | 0.593832 | 1.024695 | 0.393355 | 0.722636 | -0.63952 | -0.6097 |
| Feeding | 1.079114 | 0.634335 | -0.45891 | -0.67102 | -0.11746 | -0.56092 |
| SocioSex | -1.0408 | -0.53675 | 1.180064 | -1.03234 | -0.69172 | -0.31704 |
| Parenting | -0.63214 | -1.12229 | -1.1145 | 0.98072 | 1.448703 | 1.487657 |
Table D2: Scaled mean values of male motivational humor scores
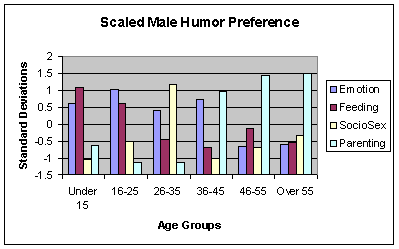
Fig. D2: Scaled mean values of male motivational humor scores